Figure 9. Patches of continuous shrub cover and downed logs with the largest dimension of their large end >50 cm. The shrubs and downed woods are important factors in tree demography, and the species composition of shrubs varies with time since fire. And in this fire-dominated system, knowing the arrangement of big logs is important to understanding the spatial aspects of fire-related mortality.
Yosemite Forest Dynamics Plot
Summary
Site Description
The YFDP is located near Crane Flat in Yosemite National Park, with the plot center at 37.77° N, 119.82° W. Elevation ranges between 1774.1 m and 1911.3 m for a vertical relief of 137.2 m (Fig. 1).
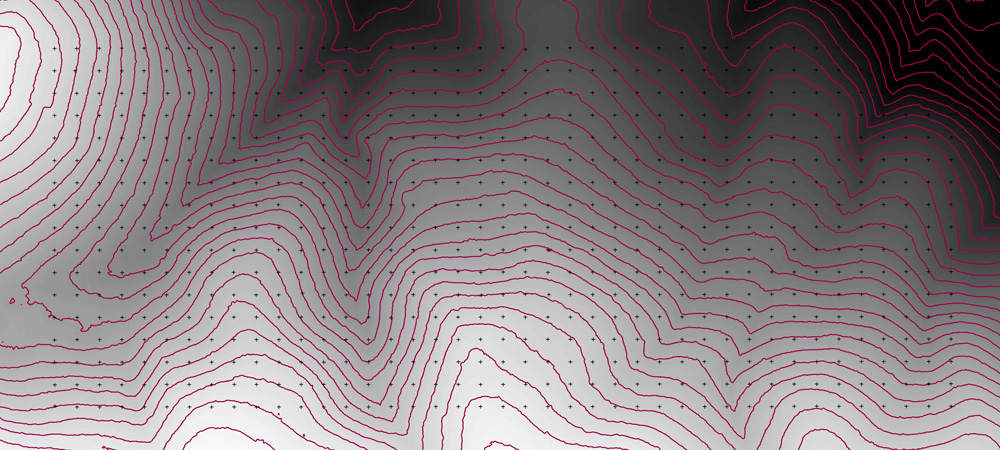
Figure 1. Topography of the Yosemite Forest Dynamics Plot. The 20 m grid is shown on a LiDAR-derived digital elevation model of the plot (1 m horizontal resolution). The maximum elevation within the plot is 1,911 m; the minimum elevation is 1,774 m (5 m contours shown).
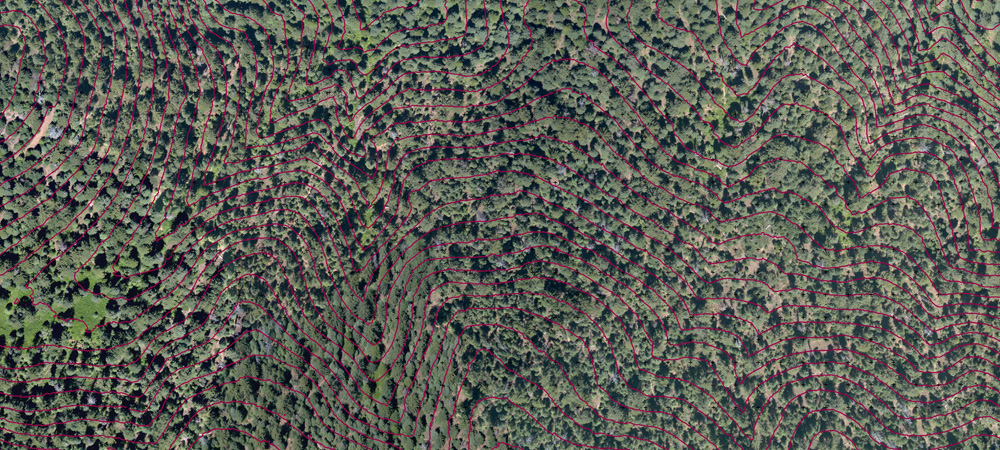
Figure 2. Orthophoto of the Yosemite Forest Dynamics Plot. This 15 cm resolution orthophoto matches the spatial extent of the topography in Fig. 1 (5 m contours superimposed).
Meteorology

Figure 3. Temperature and precipitation in the Yosemite Forest Dynamics plot (top) from PRISM 800 m climate normals (1971-2000) and the water balance (bottom) using a Thornthwaite-type evapotranspiration model.
Demography
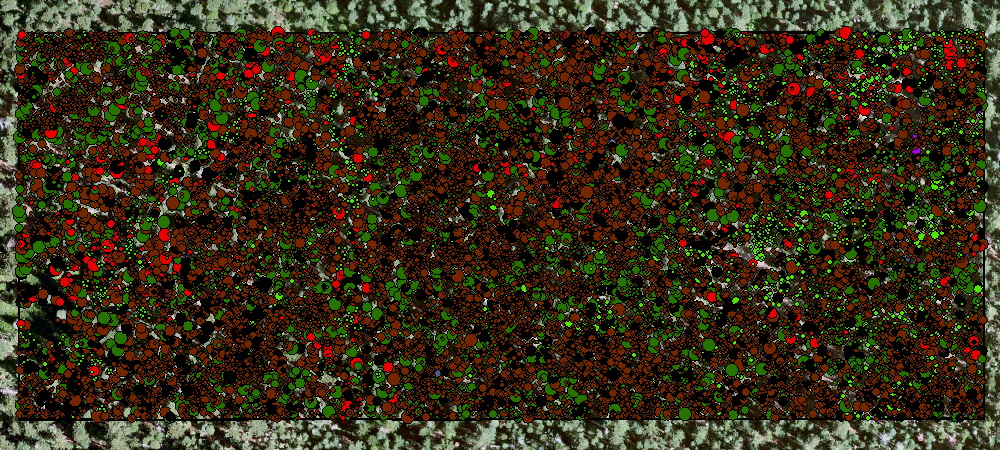
Figure 4. Every woody stem ≥1 cm diameter at breast height (DBH, 1.37 m) has been tagged (34,458 live trees and 2,697 snags in 2010). Mortality surveys are conducted annually, factors associated with death are identified for all newly dead trees, and ingrowth trees are tagged. Diameter is remeasured every 5 years.
Instrumentation
Dendrometer bands
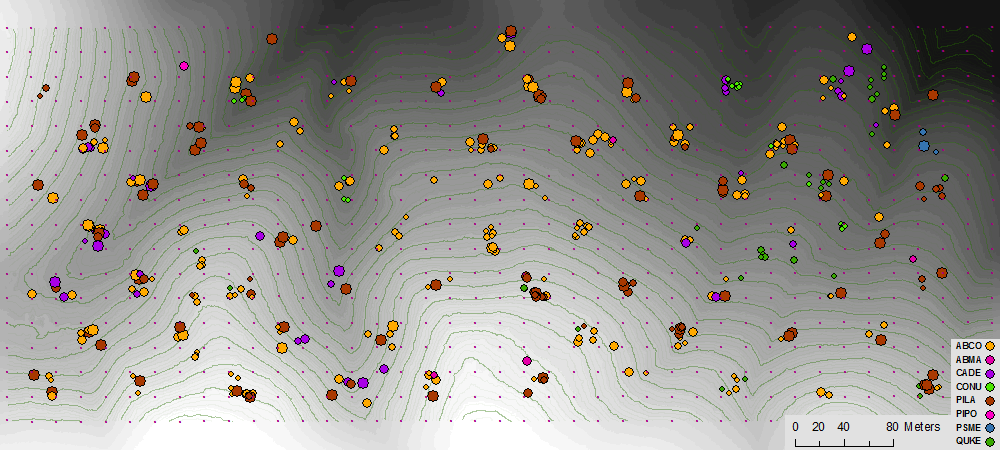
Figure 5. The 420 manual dendrometer bands were installed in 2013 and 2014 (including additional dendrometers to capture post-fire growth heterogeneity). These bands are remeasured periodically throughout the growing season to monitor tree growth and timing of water availability.
Temperature sensors and seedling study
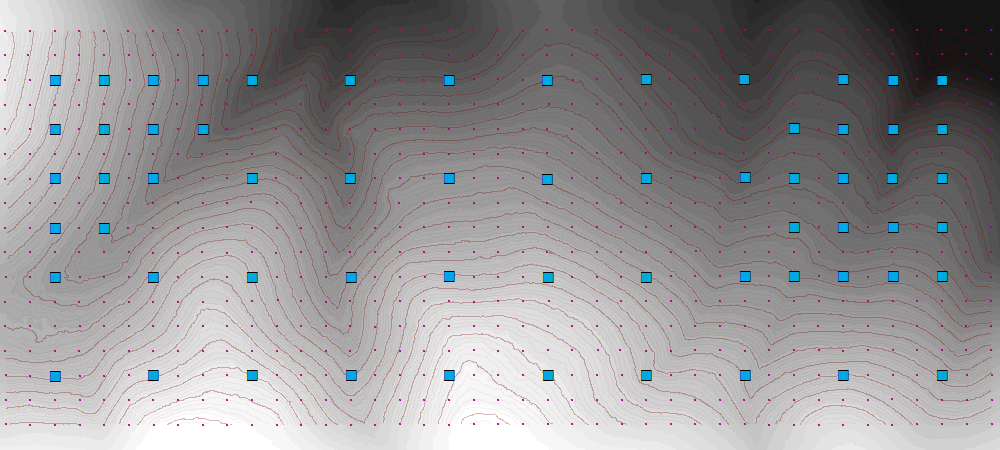
Figure 6. Locations of 63 seedling subplots. Each subplot contains a 0.3 m2 seed trap to measure dispersal and a 1 m2 quadrat to measure seedling establishment and demography. Each subplot also contains a data logging temperature and light sensor (Onset HOBO logger).
Coarse woody debris

Figure 7. Locations of coarse woody debris ≥10 cm diameter at the large end (main stems only).
Remote sensing
LiDAR
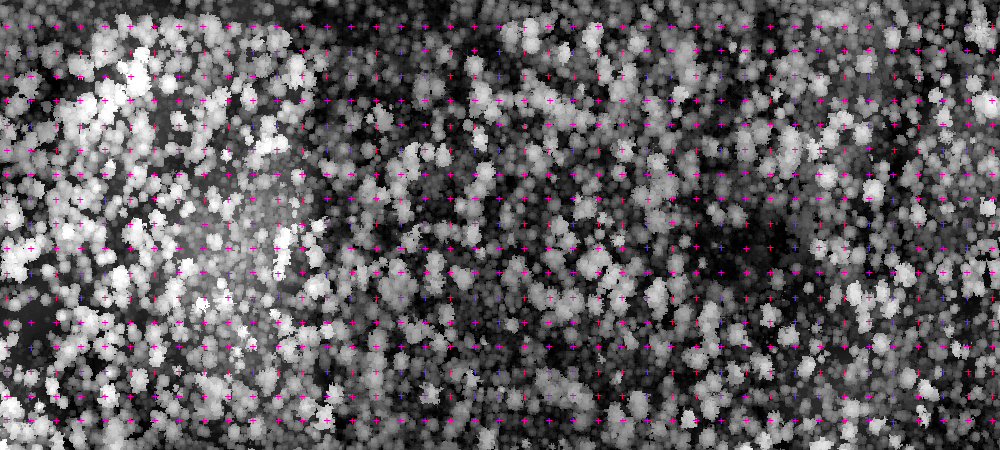
Figure 8. High resolution LiDAR point cloud showing canopy heights in the YFDP.
Landsat fire severity
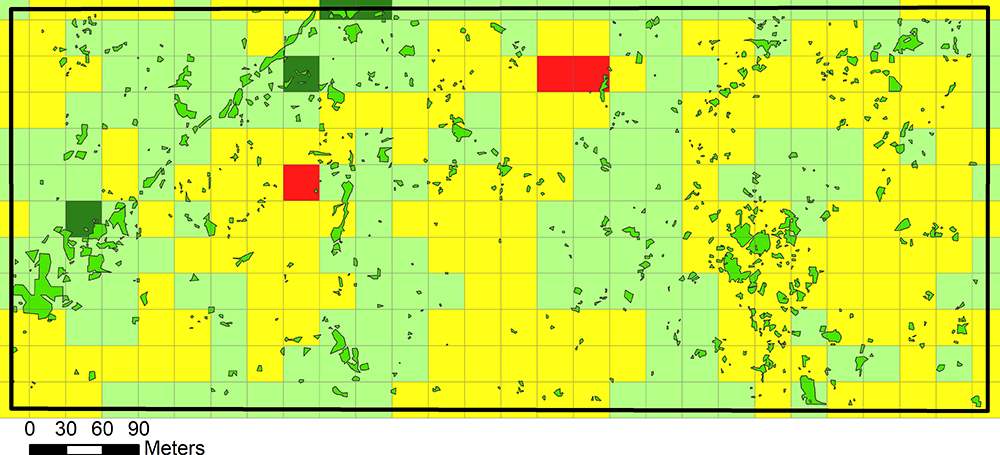
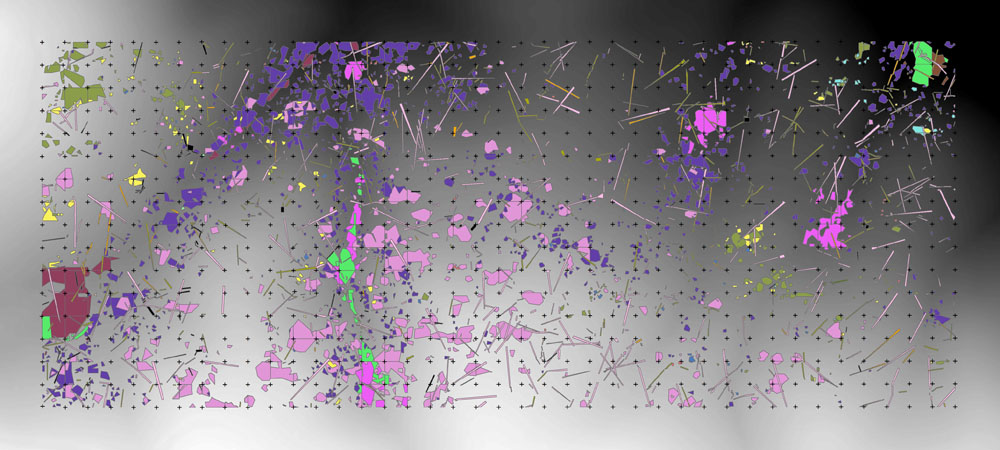
Figure 9. 238 Landsat pixels fully contained within the YFDP displaying Landsat-derived fire severity (dNBR) for the Rim Fire of 2013 (classification values following Miller and Thode [2007]). Pre-fire image (6/21/2013) and post-fire image (6/20/2014) both from Landsat 8.
Shrubs and Coarse Woody Debris
Woody Plant Species reaching 1 cm dbh
| Tree Species | Family |
| Abies concolor | Pinaceae |
| Abies magnifica | Pinaceae |
| Calocedrus decurrens | Cupressaceae |
| Cornus nuttallii | Cornaceae |
| Frangula californica | Rhamnaceae |
| Pinus lambertiana | Pinaceae |
| Pinus ponderosa | Pinaceae |
| Prunus spp. | Rosaceae |
| Pseudotsuga menziesii | Pinaceae |
| Salix scouleriana | Salicaceae |
| Shrub Species | Family |
| Arctostaphylos patula | Ericaceae |
| Ceanothus cordulatus | Rhamnaceae |
| Ceanothus integerrimus | Rhamnaceae |
| Ceanothus parvifolius | Rhamnaceae |
| Chrysolepis sempervirens | Fagaceae |
| Cornus serecia | Cornaceae |
| Corylus cornuta subsp. californica | Betulaceae |
| Leucothoe davisiae | Ericaceae |
| Rhododendron occidentale | Ericaceae |
| Ribes nevadense | Grossulariaceae |
| Ribes roezlii | Grossulariaceae |
| Sambucus racemosa | Adoxaceae |
| Vaccinium uliginosum | Ericaceae |